Hydrogeologic Data
 |
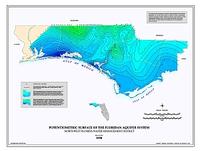
Potentiometric Surface of the Florida Aquifer in the Northwest Florida Water Management District, September 2016by Roger A. Countryman. This map represents the potentiometric surface of the Floridan Aquifer System as it was in September 2016. The entire Northwest Florida Water Management District is represented. In the westernmost panhandle, the contours represent the upper limestone unit of the Floridan Aquifer System. Elsewhere, they represent the upper part of the undifferentiated Floridan Aquifer System. The contours were generated from data collected by the District. A total of 164 data points were incorporated into the map. Minor, localized depressions in the potentiometric surface may not be apparent on this regional scale map. The scale of the base map upon which the contours were drawn is 1:450,000. The contour interval is ten feet. Map layout and formatting by NWFWMD. Contours produced by the Florida Geological Survey with data provided by the NWFWMD. Information on contour development is available at the following link: http://fdep.maps.arcgis.com/apps/OnePane/basicviewer/index.html?appid=2818519369a4451cb182ac71d6e8d14f. 81/2″ X 11″ | 2.11MB Download ArcGIS Shapefile (zipped folder) |
 |
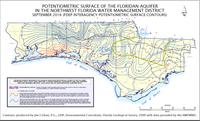
Potentiometric Surface of the Florida Aquifer in the Northwest Florida Water Management District, June 2010by Roger A. Countryman, Chris Richards, Gary Miller. This map represents the potentiometric surface of the Floridan Aquifer System as it was in June 2010. The entire Northwest Florida Water Management District is represented. In the westernmost panhandle, the contours represent the upper limestone unit of the Floridan Aquifer System. Elsewhere, they represent the upper part of the undifferentiated Floridan Aquifer System. The contours were generated from data collected by the District. A total of 164 data points were incorporated into the map. Minor, localized depressions in the potentiometric surface may not be apparent on this regional scale map. The scale of the base map upon which the contours were drawn is 1:450,000. The contour interval is ten feet. Reference: NWFWMD Water Resource Map Series 2010-01. 81/2″ X 11″ | 1.0MB PDF Download ArcGIS Shapefile (zipped folder) |
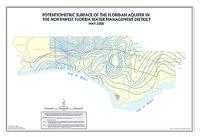 |
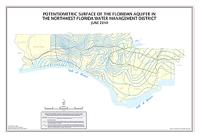
Potentiometric Surface of the Florida Aquifer in the Northwest Florida Water Management District, May 2008by Roger A. Countryman, Chris Richards, Gary Miller. This map represents the potentiometric surface of the Floridan Aquifer System as it was in May 2008. The entire Northwest Florida Water Management District is represented. In the westernmost panhandle, the contours represent the upper limestone unit of the Floridan Aquifer System. Elsewhere, they represent the upper part of the undifferentiated Floridan Aquifer System. The contours were generated from data collected by the District. A total of 156 data points were incorporated into the map. Minor, localized depressions in the potentiometric surface may not be apparent on this regional scale map. The scale of the base map upon which the contours were drawn is 1:450,000. The contour interval is ten feet. Reference: NWFWMD Water Resource Map Series 08-1. 81/2″ X 11″ | 1.74MB PDF |
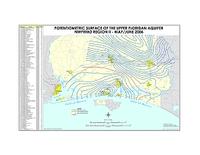 |
Potentiometric Surface of the Upper Florida Aquifer, NWFWMD Region II, May/June 2006by Roger A. Countryman, Thomas R. Pratt and Gary Miller. This map represents the potentiometric surface of the upper Floridan Aquifer System as it was during mid-May thru mid-June 2006. The Florida counties of Santa Rosa, Okaloosa, and Walton are represented. These three counties have been designated by the District as Water Supply Planning Region II. In general, the contours in the western three-quarters of the map represent the potentiometric surface of the differentiated, upper Floridan Aquifer and the contours in the eastern one-quarter represent the potentiometric surface of the upper portion of the undifferentiated Floridan Aquifer. The contours were generated from data collected by the District. A total of 159 data points were incorporated into the map. An attempt was made to measure static, non-pumping, water levels in each well. The resultant water level elevation for some wells might reflect a residual drawdown due to nearby pumping. Localized depressions in the potentiometric surface were generalized at the regional scale and are not necessarily apparent on the map. The scale of the base map upon which the contours were drawn is 1:200,000. All map-table water level values are in feet relative to mean sea level (msl). The contour interval is ten feet. Reference: NWFWMD Water Resource Map Series 06-2. 81/2″ X 11″ | 980KB |
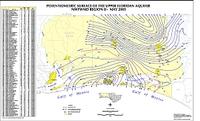 |
Potentiometric Surface of the Upper Floridan Aquifer, NWFWMD Region II, May 2003by Roger A. Countryman, Thomas R. Pratt and Gary Miller. This map represents the potentiometric surface of the upper Floridan Aquifer System as it was during May 2003. The Florida counties of Santa Rosa, Okaloosa, and Walton are represented. These three counties have been designated by the District as Water Supply Planning Region II. In general, the contours in the western three-quarters of the map represent the potentiometric surface of the differentiated, upper Floridan Aquifer and the contours in the eastern one-quarter represent the potentiometric surface of the upper portion of the undifferentiated Floridan Aquifer. The contours were generated from data collected by the District. A total of 146 data points were incorporated into the map. The scale of the base map upon which the contours were drawn is 1:200,000. All map-table elevation and water level values are in feet relative to mean sea level (msl) or land surface datum (lsd). The contour interval is ten feet. Reference: NWFWMD Water Resource Map Series 03-2. 81/2″ X 11″ | 572KB |
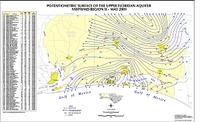 |
Potentiometric Surface of the Upper Floridan Aquifer, NWFWMD Region II, May 2001by Roger A. Countryman, Thomas R. Pratt and Gary Miller. This map represents the potentiometric surface of the upper Floridan Aquifer System as it was during May 2001. The Florida counties of Santa Rosa, Okaloosa, and Walton are represented. These three counties have been designated by the District as Water Supply Planning Region II. In general, the contours in the western three-quarters of the map represent the potentiometric surface of the differentiated, upper Floridan Aquifer and the contours in the eastern one-quarter represent the potentiometric surface of the upper portion of the undifferentiated Floridan Aquifer. The contours were generated from data collected by the District. A total of 129 data points were incorporated into the map. The scale of the base map upon which the contours were drawn is 1:200,000. All map-table elevation and water level values are in feet relative to mean sea level (msl) or land surface datum (lsd). The contour interval is ten feet. Reference: NWFWMD Water Resource Map Series 03-1. 81/2″ X 11″ | 567KB |
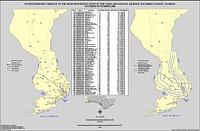 |
Potentiometric Surface of the Main Producing Zone of the Sand-and-Gravel Aquifer, Escambia County, Florida, October/November 2000by Roger A. Countryman, Alan Baker, Thomas R. Pratt and Gary Miller. This map represents the potentiometric surface of the Main Producing Zone of the Sand-and-Gravel Aquifer in Escambia County, Florida as it was during October and November of 2000. The interpretation of the potentiometric surface is limited to the more densely populated southern half of Escambia County and represents the semi-confined zone from which most of the county’s drinking water is withdrawn. The contours were generated from data collected by the District. A total of 87 data points were incorporated into the map. The scale of the base map upon which the contours were drawn is 1:200,000. The contour interval is 10 feet. Reference: NWFWMD Water Resource Map Series 01-2. 81/2″ X 11″ | 720KB |
|
Potentiometric Surface of the Surficial Zone of the Sand-and-Gravel Aquifer, Escambia County, Florida, October/November 2000by Roger A. Countryman, Alan Baker, Thomas R. Pratt and Gary Miller. This map represents the potentiometric surface of the Surficial Zone of the Sand-and-Gravel Aquifer in Escambia County, Florida as it was during October and November of 2000. The interpretation of the potentiometric surface is limited to the more densely populated southern half of Escambia County and represents water table conditions. The contours were generated from data collected by the District. A total of 36 data points were incorporated into the map. Significant hydrologic surface features were considered when approximating the potentiometric surface. The scale of the base map upon which the contours were drawn is 1:200,000. The contour interval is 20 feet. Reference: NWFWMD Water Resource Map Series 01-1. 81/2″ X 11″ | 697MB |
|
|
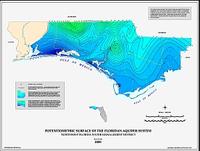
Potentiometric Surface of the Floridan Aquifer System in Northwest Florida, May/June 2000by Alan Baker, Gary Miller and Thomas R. Pratt. These items represents the potentiometric surface of the Floridan Aquifer System as it was in May and June of 2000. The entire Northwest Florida Water Management District is represented. In the westernmost panhandle, the contours represent the upper limestone unit of the Floridan Aquifer System. Elsewhere, they represent the upper part of the undifferentiated Floridan Aquifer System. Data used to generate the contours were collected by the District. A total of 157 data points were incorporated into the map. The scale of the base map upon which the contours were draw is 1:500,000. The contour interval is 10 feet. Reference: NWFWMD Map Series 00-5. 81/2″ X 11″ | 1.18MB |
|
|
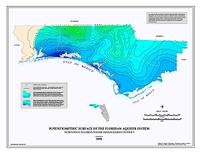
Potentiometric Surface of the Floridan Aquifer System in Northwest Florida, May/June 1998by Michael T. Maloney, Christopher J. Richards, and Thomas R. Pratt. These items represent the potentiometric surface of the Floridan Aquifer System as it was in May and June of 1998. The entire Northwest Florida Water Management District is represented. In the westernmost panhandle, the contours represent the upper limestone unit of the Floridan Aquifer System. Elsewhere they represent the upper part of the undifferentiated Floridan Aquifer System. Data used to generate the contours were collected by the District. Data were contoured by the District. A total of 139 data points were incorporated into the map. The contour interval is 10 feet. The scale of the base map upon which the contours were drawn is 1:500,000. Reference: NWFWMD Map Series 98-1. 81/2″ X 11″ | 1.20MB |
 |
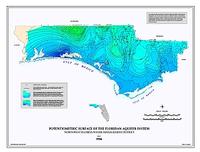
Potentiometric Surface of the Floridan Aquifer System in Northwest Florida, August 1996by Christopher J. Richards. These items represent the potentiometric surface of the Floridan Aquifer System as it was in August of 1996. The counties of Washington, Bay, Holmes, Walton, Jackson, Calhoun, and Gulf are represented. The contours represent the upper portion of the undifferentiated Floridan Aquifer System. Data used to generate the contours were collected by the District. Data were contoured by the District. A total of 130 data points were incorporated into the map. The scale of the base map upon which contours were drawn is 1:150,000. The contour interval is 10 feet and the supplementary contour interval is 5 feet. Reference: NWFWMD Water Resources Special Report 97-2. 81/2″ X 11″ | 1.15MB |
|
|
Potentiometric Surface of the Floridan Aquifer System in Northwest Florida, June/July 1995by Jeffrey L. Hardee, Christopher J. Richards, Honesto P. Roaza, Katherine A. Milla, Joseph Knight, and Thomas R. Pratt. These items represent the potentiometric surface of the Floridan Aquifer as it was in June and July of 1995. The entire Northwest Florida Water Management District is represented. In the westernmost panhandle, the contours represent the upper limestone unit of the Floridan Aquifer System. Elsewhere, they represent the upper part of the undifferentiated Floridan Aquifer System. Data used to generate the contours were collected by the District. A total of 117 data points were incorporated into the map. The scale of the base map upon which contours were drawn is 1:500,000. The contour interval is 10 feet. Reference: NWFWMD Map Series 96-1. 81/2″ X 11″ | 1.23MB |

|
Potentiometric Surface of the Floridan Aquifer System in Northwest Florida, May 1991by J Peterson, Jeffry R. Wagner, and Christopher J. Richards. These items represent the potentiometric surface of the Floridan Aquifer System as it was in May of 1991. The entire Northwest Florida Water Management District is represented. In the westernmost panhandle, the contours represent the upper limestone unit of the Floridan Aquifer System. Elsewhere, they represent the upper part of the undifferentiated Floridan Aquifer System. Data used to generate the contours were collected by the District. Data were contoured by the District. A total of 271 data points were incorporated into the map. The contour interval is 10 feet. The scale of the base map upon which contours were drawn is 1:500,000. Reference: NWFWMD Map Series 99-1. 81/2″ X 11″ | 1.23MB |
|
Potentiometric Surface of the Floridan Aquifer System in Northwest Florida, May 1986by Jeffry R. Wagner. These items represent the potentiometric surface of the Floridan Aquifer System as it was in May of 1986. The entire Northwest Florida Water Management District is represented. In the westernmost panhandle, the contours represent the upper limestone unit of the Floridan Aquifer System. Elsewhere, they represent the upper part of the undifferentiated Floridan Aquifer System. Data used to generate the contours were collected by the District. A total of 573 data points were incorporated into the map. The scale of the base map upon which contours were drawn is 1:500,000. The contour interval is 10 feet. The coverage was digitized by the District from a paper copy of the reference publication. Reference: NWFWMD Map Series 89-1. 81/2″ X 11″ | 1.27MB |